Society 5.0
Society 5.0 is a vision for a future society that integrates advanced technologies, such as the Internet of Things (IoT), artificial intelligence (AI), and big data, to create a more sustainable, inclusive, and human-centered society. In this context, smart monitoring systems play a crucial role in enhancing situational awareness, supporting decision-making, and enabling early warning systems for various applications, including environmental monitoring, infrastructure management, and disaster risk reduction.
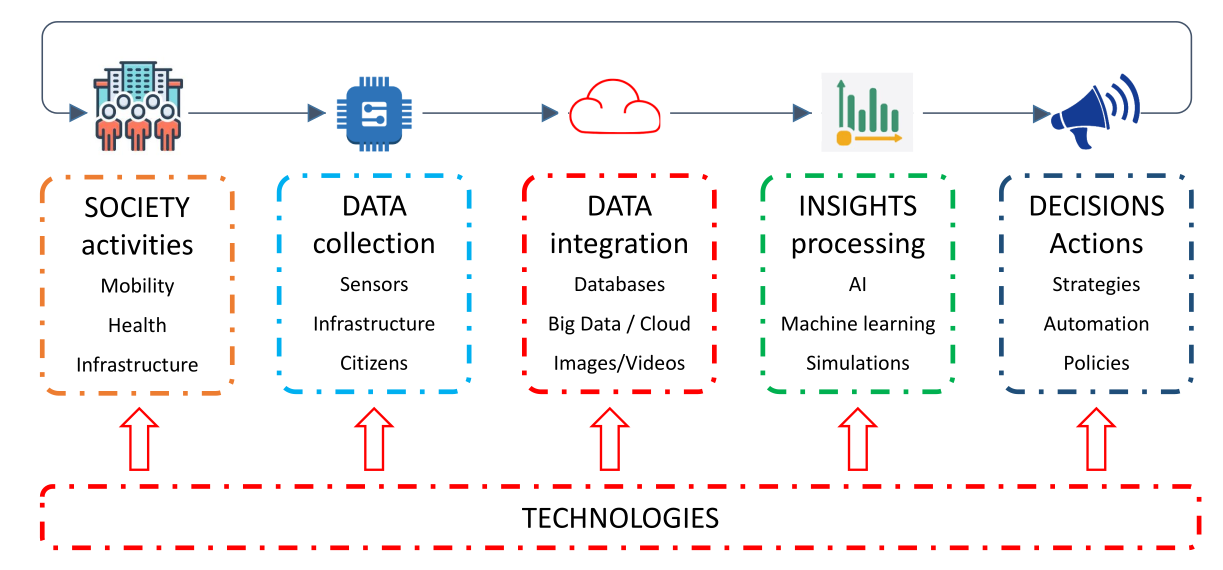
Conceptual data flow (from sensor to decision)
Sensors are used to traslate physical phenomena into digital data. Digital data representing the physical world are the basis for enhancing situational awareness, supporting decision-making and enabling early warning systems. We do not have to forget that the digital representation of the real world, the so callked digital twin, make sense only if permits to extract useful insights and actionable information.
Data Management
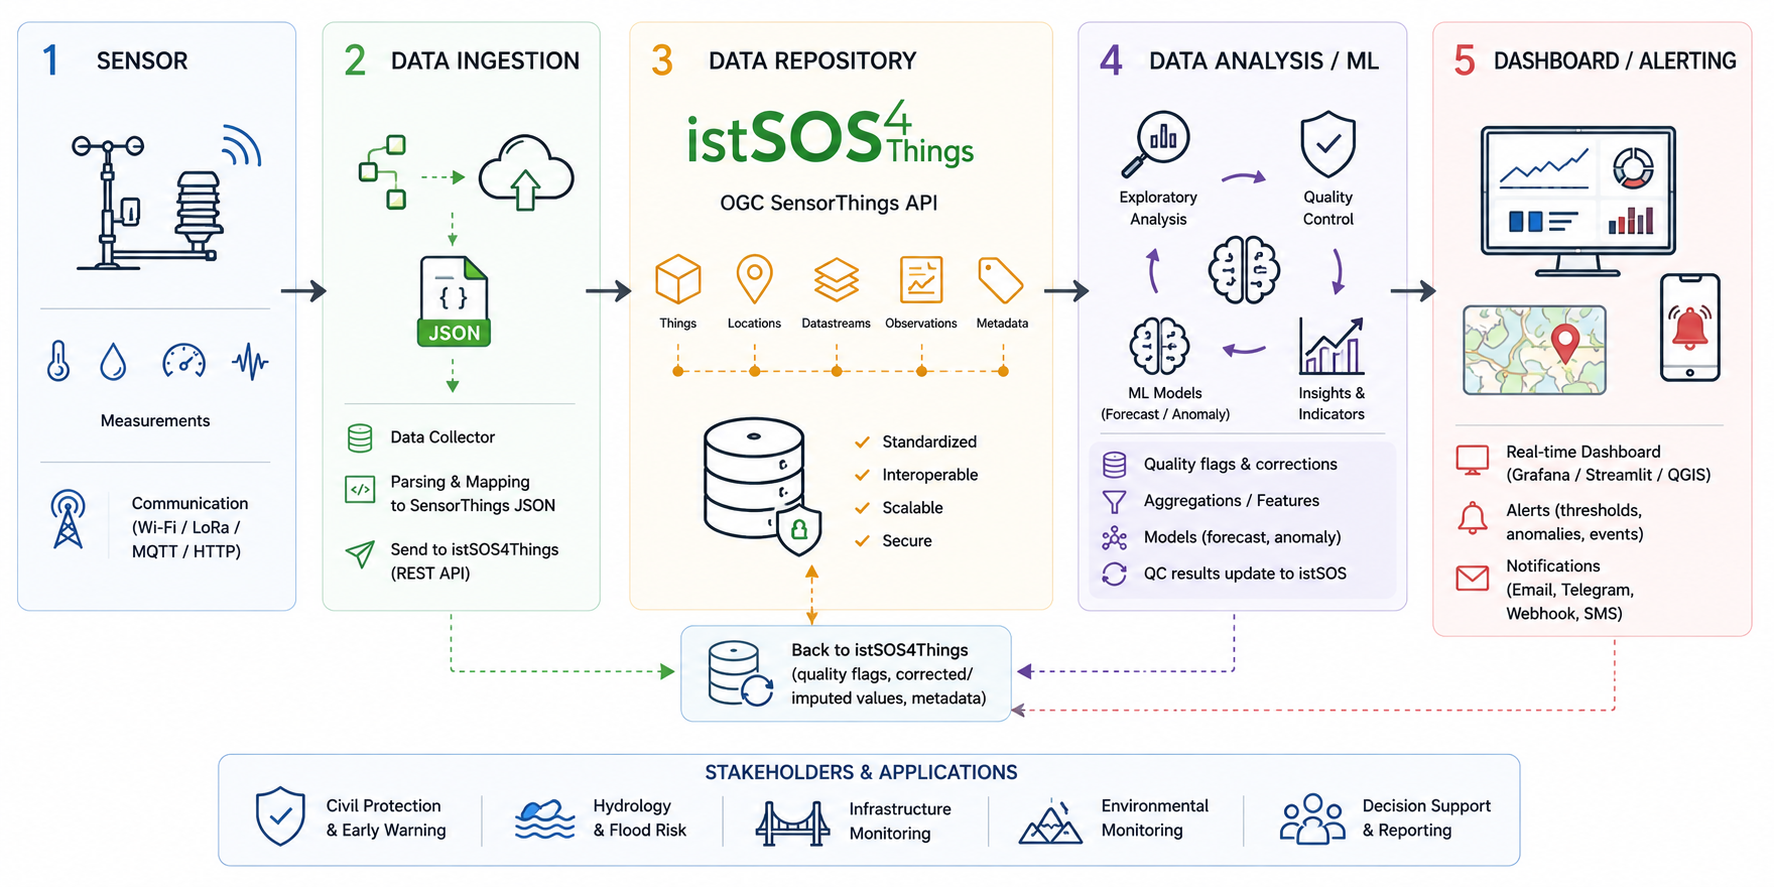
The data management process for smart monitoring systems typically involves several stages, including in-situ data collection trough sensors, data communication and integration, data storing and serving, data analitichs and quality controls, reporting and alarming. Each stage is crucial to ensure that the data is reliable, accurate and useful for decision-making.
Quality control (QC)
The quality of the data collected by sensors is critical for the reliability and usefulness of the digital twin. Unfortunately, sensors may drift over time, communication failures may create missing observations, electronic noise may generate unrealistic values, and extreme environmental conditions may produce signals that are difficult to distinguish from sensor errors. DUe to these issues, raw sensor data cannot automatically be considered reliable and must be subjected to quality control (QC) procedures that opportunately detect and handle these issues either by correcting data or flagging it for further consideration (e.g. using different weigths based on data quality).
Most commonly data are exposed to a sequential QC pipeline where each test or operation evaluates observations and updates their quality flags (aka quality annotations), which can later guide filtering, correction, interpolation or alerting.
The objective of quality control is not simply to remove “bad data”, but rather to evaluate the reliability of each observation, identify suspicious measurements, document uncertainties and preserve traceability throughout the analysis proces which can later guide filtering, correction, interpolation or alerting.
A QC workflow is typically implemented as a sequence of checks applied to the dataset. Each observation is evaluated independently or in relation to neighbouring observations. Instead of directly modifying the data, the system usually assigns a quality state or a flag to each measurement (aka quality annotations). Conceptually, each observation therefore becomes associated not only with a value, but also with information describing its reliability.
| Timestamp | Value | Quality State |
|---|---|---|
| 10:00 | 15.2 | valid |
| 11:00 | 999 | invalid |
| 12:00 | NaN | missing |
| 13:00 | 14.8 | suspicious |
Very often the quality annotations are mapped to a numerical code, for example:
| Quality State | Code | Meaning |
|---|---|---|
| missing | 0 | Observation is missing or not available |
| raw value | 1 | Raw observation without any QC applied |
| invalid | 2 | Observation with value out of physical limits |
| souspicious | 3 | Observation is outside of a plausibility range |
| alarm | 4 | Observation is outside of statistical ranges and may indicate an extreme event or potential hazard |
| valid | 5 | Observation is valid and reliable (often after manual control) |
Nevertheless, different types of quality checks can be applied depending on the problem being investigated. Missing-data checks identify gaps caused by communication failures or power interruptions. Range checks verify whether observations remain within physically plausible limits. Outlier detection methods identify values that strongly differ from the expected behaviour of the signal. Temporal consistency checks analyse whether changes between consecutive observations are realistic. Drift analysis evaluates whether a sensor progressively deviates from its expected behaviour over time.
a monitoring pipeline must distinguish between data quality problems and real hazardous events.
An important aspect of quality control is distinguishing between actual data problems and real hazardous events. Some anomalous observations may indeed correspond to sensor malfunctions, while others may represent real environmental phenomena such as floods, landslides or extreme rainfall. For this reason, quality control should not blindly remove all anomalous observations. Instead, the workflow should support interpretation, traceability and informed decision-making.
Quality control is also essential for machine learning and forecasting applications. Predictive models are highly sensitive to data quality, and erroneous observations may significantly reduce model accuracy or generate false alarms. A robust QC pipeline therefore becomes a fundamental step before performing forecasting, anomaly detection or advanced analytics.
Modern monitoring systems should preserve raw observations, quality annotations and corrected datasets separately. This ensures reproducibility, transparency and scientific traceability, allowing future users to understand how data were processed and validated throughout the workflow.
Recommended Workflow
For each dataset:
- Load the dataset.
- Parse timestamps.
- Plot the raw time series.
- Identify the suspected issue.
- Apply at least one visual detection method.
- Apply at least one statistical or ML-based method.
- Decide whether the issue should be corrected, removed, flagged or preserved.
- Produce a cleaned or enriched dataset.
- Document all assumptions.
- Propose an alerting or monitoring rule.
Good practice: always preserve raw data, cleaned data, quality flags, correction method and processing code.